目录 echarts关系图动态增删节点及连线 echarts关系图vue完整代码 echarts关系图动态增删节点及连线 首先,echarts的关系图有个非常坑的地方,就是节点的id必须连续,否则增删之后节点无法
目录
- echarts关系图动态增删节点及连线
- echarts关系图vue完整代码
echarts关系图动态增删节点及连线
首先,echarts的关系图有个非常坑的地方,就是节点的id必须连续,否则增删之后节点无法连接!
下面是简单的演示实现,实际要用动态增删的话,要复杂的多得多。
我是用的关系图是力引导图
更新后不会重新渲染,只是动态增加的效果
//假设你已经渲染了关系图
test() {
      let option = this.chart.getOption() //获取option配置项

      //START增加节点,假设根据id连线
      // option.series[0].data.push({name: '测试节点', category: 1, id: 6, des: '测试描述'})
      // option.series[0].links.push({source: 0, target: 6, name: '测试连线'})
      //END

      //删除节点START
      let data = option.series[0].data //获取节点数据
      let link = option.series[0].links //获取边的数据
      let flag = -1
      for(let i = 0; i<data.length;i++){//假设删除id为1的节点
        if (data[i].id===1){
          data.splice(i,1)
          link.splice(i-1,1)
          flag = i
          break
        }
      }
      for(let i = flag; i<data.length;i++){
        data[i].id--
        if (i!==data.length){
          link[i-1].target--
        }
      }
      //删除节点END

      //更新关系图
      this.chart.setOption(option)
    },
echarts关系图vue完整代码
vue 使用echarts 实现关系图,效果如下:
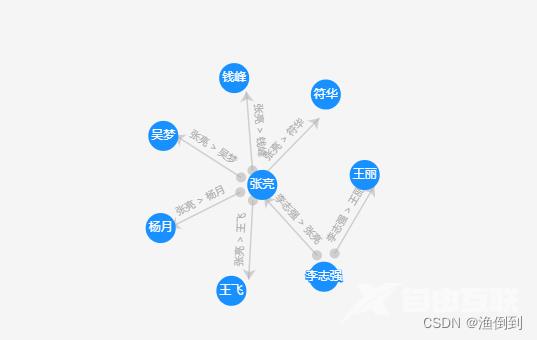
说明: 关系图可以有两种,一种是指定坐标x,y。 另外一种就是通过设置series属性
layout: "force",
force: {
          repulsion: [-2, 100], //节点之间的斥力因子。支持数组表达斥力范围,值越大斥力越大。
          gravity: 0.03, //节点受到的向中心的引力因子。该值越大节点越往中心点靠拢。
          edgeLength: [20, 200], //边的两个节点之间的距离,这个距离也会受 repulsion:[10, 50]值越小则长度越长
          layoutAnimation: false,
        },
vue全部代码如下
<template>
  <div class="uni-chart-container">
    <div class="uni-bar-charts" :id="id"></div>
  </div>
</template>
<script>
import echarts from "echarts";
import resize from "../mixins/resize";
export default {
  name: "uniGraph",
  mixins: [resize],
  components: {},
  data() {
    return {
      options: {
        title: {
          text: "",
        },
        series: [],
      },
      barData: [],
      myChart: null,
      seriesName: "",
    };
  },
  props: {
    id: {
      type: String,
      require: true,
    },
    sortMethod: {
      type: String,
      default: "desc",
    },
    title: {
      type: String,
    },
    optionsSetup: {
      type: Object,
      default: () => {
        return {};
      },
    },
    isVertical: {
      type: Boolean,
      default: true,
    },
    chartsData: {
      type: Object,
      default: function () {
        return {
          nodes: [
            {
              name: "李志强",
              category: 0,
              symbolSize: 30,
              value: ["确诊"],
              color: "#F10F0F",
            },
            {
              name: "张亮",
              category: 2,
              symbolSize: 30,
              value: ["密接"],
              color: "#FFC001",
            },
            {
              name: "王飞",
              category: 1,
              symbolSize: 30,
              value: ["次密接"],
              color: "#1D84C6",
            },
            {
              name: "王丽",
              category: 2,
              symbolSize: 30,
              value: ["密接"],
              color: "#FFC001",
            },
            {
              name: "符华",
              category: 1,
              symbolSize: 30,
              value: ["次密接"],
              color: "#1D84C6",
            },
            {
              name: "钱峰",
              category: 1,
              symbolSize: 30,
              value: ["次密接"],
              color: "#1D84C6",
            },
            {
              name: "吴梦",
              category: 1,
              symbolSize: 30,
              color: "#1D84C6",
              value: ["次密接"],
            },
            {
              name: "杨月",
              category: 1,
              symbolSize: 30,
              color: "#1D84C6",
              value: ["次密接"],
            },
          ],
          links: [
            {
              source: "李志强",
              target: "张亮",
              linkTip: "聚餐",
            },
            {
              source: "张亮",
              target: "王飞",
              linkTip: "出现在同一场所",
            },
            {
              source: "李志强",
              target: "王丽",
              linkTip: "出现在同一场所",
            },
            {
              source: "张亮",
              target: "钱峰",
              linkTip: "聚餐",
            },
            {
              source: "张亮",
              target: "符华",
              linkTip: "家庭聚集",
            },
            {
              source: "张亮",
              target: "杨月",
              linkTip: "出现在同一场所",
            },
            {
              source: "张亮",
              target: "吴梦",
              linkTip: "出现在同一场所",
            },
          ],
          categories: [
            {
              name: "确诊",
            },
            {
              name: "次密接",
            },
            {
              name: "密接",
            },
          ],
        };
      },
    },
    customColor: {
      type: Array,
      default: function () {
        return ["#1890FF"];
      },
    },
    // 展示前5条 可传5
    maxL: {
      default: "auto",
    },
    codeStatus: {
      type: Array,
    },
  },
  watch: {
    chartsData: {
      deep: true,
      immediate: true,
      handler: function (v) {
        let _this = this;
        this.$nextTick(function () {
          _this.init();
        });
      },
    },
  },
  beforeDestroy() {
    if (!this.myChart) {
      return;
    }
    this.myChart.dispose();
    this.myChart = null;
  },
  methods: {
    init() {
      //构建3d饼状图
      if (this.myChart) this.myChart.dispose();
      this.myChart = echarts.init(document.getElementById(this.id));
      this.editorOptions(this.chartsData);
      // 传入数据生成 option
      this.myChart.setOption(this.options);
    },
    editorOptions(val) {
      let series = this.getSeries(val);
      var options = {
        tooltip: {
          // formatter: (e) => {
          //   console.log(e);
          //   return e.name + e.data.value;
          // },
        },
        animationDuration: 1500,
        animationEasingUpdate: "quinticInOut",
        color: this.customColor,
        grid: this.setOptionsMargin(),
        series: series,
      };
      this.options = options;
    },
    getSeries(newData) {
      const series = [];
      series.push({
        name: "关系图谱",
        type: "graph",
        hoverAnimation: true,
        layout: "force",
        force: {
          repulsion: [-2, 100], //节点之间的斥力因子。支持数组表达斥力范围,值越大斥力越大。
          gravity: 0.03, //节点受到的向中心的引力因子。该值越大节点越往中心点靠拢。
          edgeLength: [20, 200], //边的两个节点之间的距离,这个距离也会受 repulsion:[10, 50]值越小则长度越长
          layoutAnimation: false,
        },
        nodeScaleRatio: 0.6,
        draggable: true,
        roam: false, //鼠标缩放和平移
        symbol: "circle",
        edgeSymbol: ["circle", "arrow"],
        data: newData.nodes,
        links: newData.links,
        categories: newData.categories,
        cursor: "pointer",
        focusNodeAdjacency: true,
        scaleLimit: {
          //所属组件的z分层,z值小的图形会被z值大的图形覆盖
          min: 0, //最小的缩放值
          max: 9, //最大的缩放值
        },
        edgeLabel: {
          //连接线上文字
          normal: {
            show: true,
            textStyle: {
              fontSize: 10,
            },
            formatter: (e) => {
              return e.name;
            },
          },
        },
        label: {
          normal: {
            show: true,
          },
        },
        lineStyle: {
          normal: {
            width: 1.5,
            curveness: 0,
            type: "solid",
          },
        },
      });
      return series;
    },
    // 边距设置
    setOptionsMargin() {
      const optionsSetup = this.optionsSetup;
      const grid = {
        left: optionsSetup.marginLeft,
        right: optionsSetup.marginRight,
        bottom: optionsSetup.marginBottom,
        top: optionsSetup.marginTop,
        containLabel: true,
      };
      return grid;
    },
  },
};
</script>
<style lang="scss">
.uni-chart-container,
.uni-bar-charts {
  width: 100%;
  height: 100%;
}
</style>
resize文件如下:debounce可以自行实现
import {
  debounce
} from "@/utils/utils.js";
export default {
  data() {
    return {};
  },
  mounted() {
    this.initListener();
  },
  beforeDestroy() {
    this.destroyListener();
  },
  deactivated() {
    this.destroyListener();
  },
  methods: {
    initListener() {
      window.addEventListener("resize", debounce(this.resize, 100));
    },
    destroyListener() {
      window.removeEventListener("resize", this.resize);
    },
    resize() {
      const {
        myChart
      } = this;
      myChart && myChart.resize();
    },
  },
};
以上为个人经验,希望能给大家一个参考,也希望大家多多支持易盾网络。