图 9.1 import matplotlib.pyplot as plt import numpy as np fig=plt.figure() ax=fig.add_subplot(111) font={"family":"monospace", "color":"maroon", "weight":"bold", "size":6} x=np.linspace(0.0, 2*np.pi, 500) y=np.cos(x)*np.sin(x) ax.plot(x, y
图 9.1


import numpy as np
fig=plt.figure()
ax=fig.add_subplot(111)
font={"family":"monospace", "color":"maroon", "weight":"bold", "size":6}
x=np.linspace(0.0, 2*np.pi, 500)
y=np.cos(x)*np.sin(x)
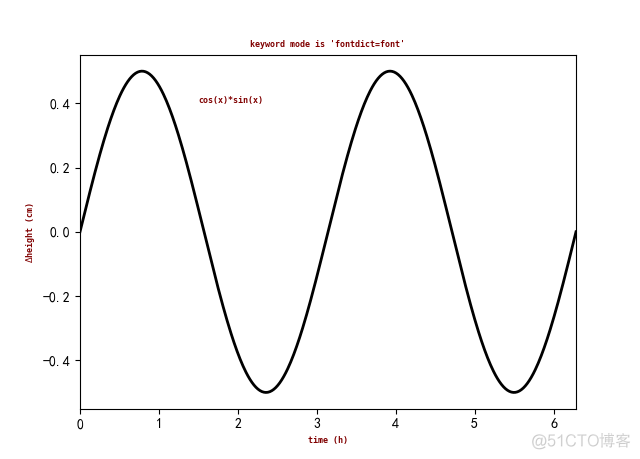
ax.plot(x, y, color="k", ls="-", lw=2)
ax.set_title("keyword mode is 'fontdict=font'", fontdict=font)
ax.text(1.5, 0.4, "cos(x)*sin(x)", fontdict=font)
ax.set_xlabel("time (h)", **font)
ax.set_ylabel(r"$\Delta$height (cm)", **font)
ax.set_xlim(0, 2*np.pi)
plt.show()
View Code
=============================================
图 9.2
import numpy as np
fig=plt.figure()
ax=fig.add_subplot(111)
font={"family":"serif", "color":"navy", "weight":"black", "size":16}
x=np.linspace(0.0, 2*np.pi, 500)
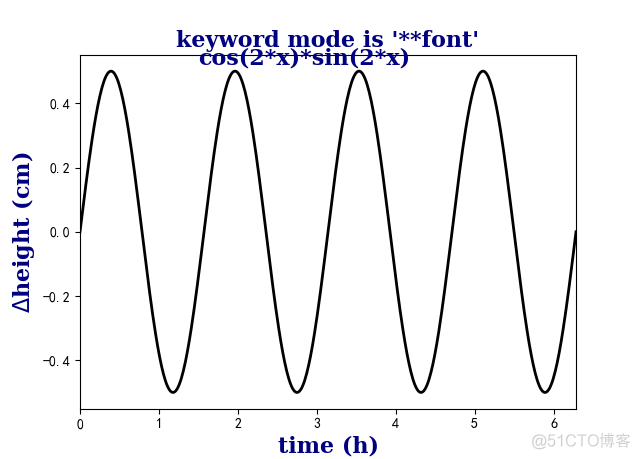
y=np.cos(2*x)*np.sin(2*x)
ax.plot(x, y, color="k", ls="-", lw=2)
ax.set_title("keyword mode is '**font'", **font)
ax.text(1.5, 0.52, "cos(2*x)*sin(2*x)", **font)
ax.set_xlabel("time (h)", **font)
ax.set_ylabel(r"$\Delta$height (cm)", **font)
ax.set_xlim(0, 2*np.pi)
plt.show()
View Code
=============================================
图 9.3
import numpy as np
font=dict(family="serif", color="navy", weight="black", size=16)
color="skyblue"
linewidth=3
fig=plt.figure()
ax=fig.add_subplot(111)
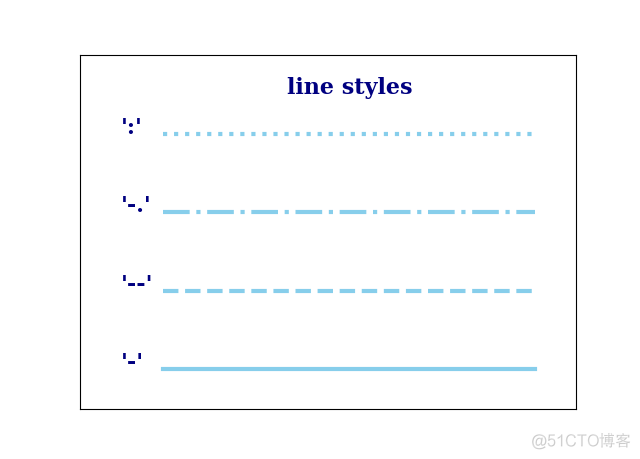
linestyleList=["-", "--", "-.", ":"]
x=np.arange(1, 11, 1)
y=np.linspace(1, 1, 10)
ax.text(4, 4.0, "line styles", **font)
for i, ls in enumerate(linestyleList):
ax.text(0, i+0.5, "'{}'".format(ls), **font)
ax.plot(x, (i+0.5)*y, linestyle=ls, color=color, linewidth=linewidth)
ax.set_xlim(-1, 11)
ax.set_ylim(0, 4.5)
ax.margins(0.2)
ax.set_xticks([])
ax.set_yticks([])
plt.show()
View Code
=============================================
图 9.4
import numpy as np
font_style=dict(family="serif", color="navy", weight="black", size=12)
line_marker_style=dict(linestyle=":", linewidth=2, color="maroon", markersize=10)
fig=plt.figure()
ax=fig.add_subplot(111)
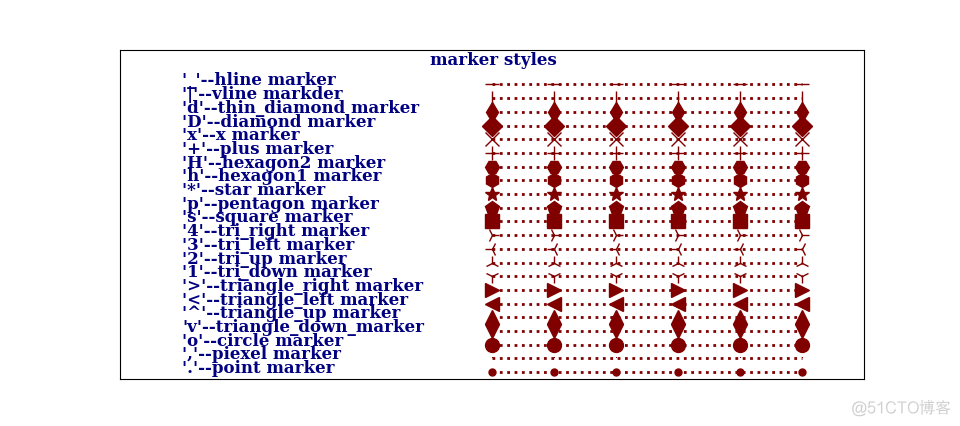
msNameList=["'.'--point marker", "','--piexel marker", "'o'--circle marker",
"'v'--triangle_down_marker", "'^'--triangle_up marker",
"'<'--triangle_left marker", "'>'--triangle_right marker",
"'1'--tri_down marker", "'2'--tri_up marker", "'3'--tri_left marker",
"'4'--tri_right marker", "'s'--square marker", "'p'--pentagon marker",
"'*'--star marker", "'h'--hexagon1 marker", "'H'--hexagon2 marker",
"'+'--plus marker", "'x'--x marker", "'D'--diamond marker", "'d'--thin_diamond marker",
"'|'--vline markder", "'_'--hline marker"]
markerstyleList=['.', ',', 'o', 'v', '^', '<', '>', '1', '2', '3', '4', 's', 'p', '*', 'h', 'H',
'+', 'x', 'D', 'd', '|', '_']
x=np.arange(5, 11, 1)
y=np.linspace(1, 1, 6)
ax.text(4, 23, "marker styles", **font_style)
for i, ms in enumerate(markerstyleList):
ax.text(0, i+0.5, msNameList[i], **font_style)
ax.plot(x, (i+0.5)*y, marker=ms, **line_marker_style)
ax.set_xlim(-1, 11)
ax.set_ylim(0, 24)
ax.margins(0.3)
ax.set_xticks([])
ax.set_yticks([])
plt.show()
View Code
=============================================
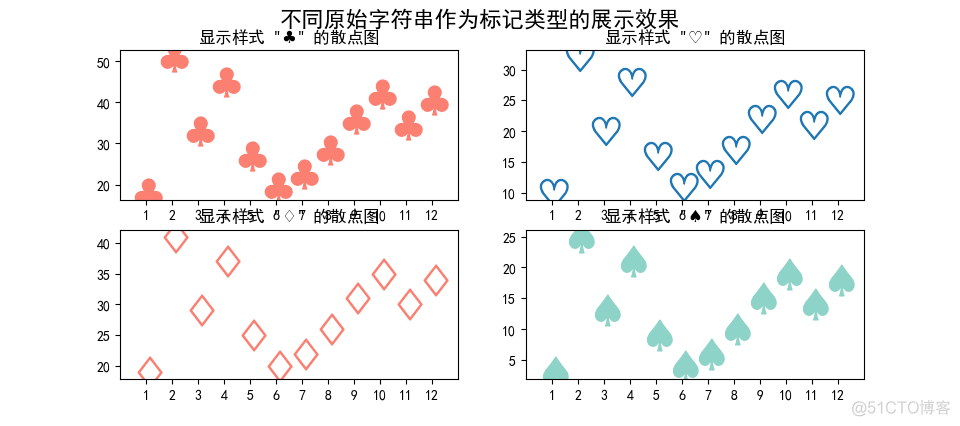
图 9.5
import matplotlib.pyplot as plt
import numpy as np
mpl.rcParams["font.sans-serif"]=["SimHei"]
mpl.rcParams["axes.unicode_minus"]=False
x=np.arange(1, 13, 1)
y=np.array([12, 34, 22, 30, 18, 13, 15, 19, 24, 28, 23, 27])
fig, ax = plt.subplots(2, 2)
ax[0, 0].scatter(x, y*1.5, marker=r"$\clubsuit$", c="#fb8072", s=500)
ax[0, 0].locator_params(axis="x", tight=True, nbins=11)
ax[0, 0].set_xlim(0, 13)
ax[0, 0].set_xticks(x)
ax[0, 0].set_title('显示样式 “%s” 的散点图' % r"$\clubsuit$")
ax[0, 1].scatter(x, y-2, marker=r"$\heartsuit$", s=500)
ax[0, 1].locator_params(axis="x", tight=True, nbins=11)
ax[0, 1].set_xlim(0, 13)
ax[0, 1].set_xticks(x)
ax[0, 1].set_title('显示样式 “%s” 的散点图' % r"$\heartsuit$")
ax[1, 0].scatter(x, y+7, marker=r"$\diamondsuit$", c="#fb8072", s=500)
ax[1, 0].locator_params(axis="x", tight=True, nbins=11)
ax[1, 0].set_xlim(0, 13)
ax[1, 0].set_xticks(x)
ax[1, 0].set_title('显示样式 “%s” 的散点图' % r"$\diamondsuit$")
ax[1, 1].scatter(x, y-9, marker=r"$\spadesuit$", c="#8dd3c7", s=500)
ax[1, 1].locator_params(axis="x", tight=True, nbins=11)
ax[1, 1].set_xlim(0, 13)
ax[1, 1].set_xticks(x)
ax[1, 1].set_title('显示样式 “%s” 的散点图' % r"$\spadesuit$")
plt.suptitle("不同原始字符串作为标记类型的展示效果", fontsize=16, weight="black")
plt.show()
View Code
=============================================
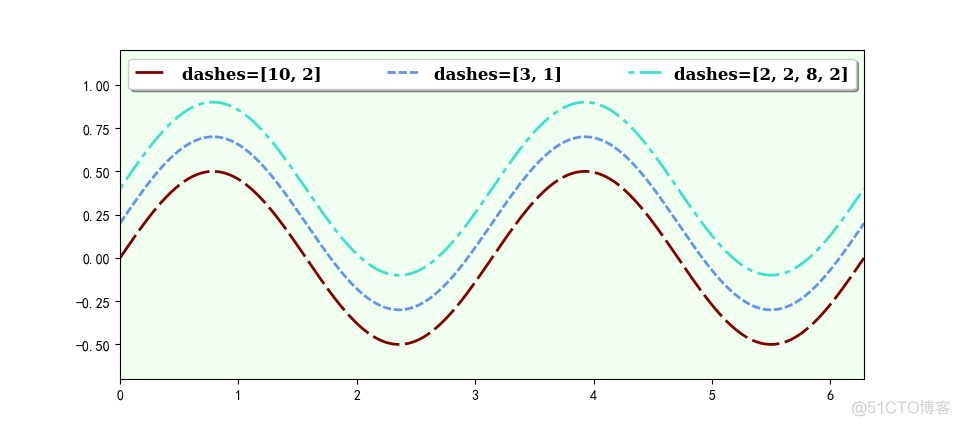
图 9.6
import numpy as np
font_style=dict(family="serif", weight="black", size=12)
line_marker_style1=dict(linestyle="--", linewidth=2, color="maroon", markersize=10)
line_marker_style2=dict(linestyle="--", linewidth=2, color="cornflowerblue", markersize=10)
line_marker_style3=dict(linestyle="--", linewidth=2, color="turquoise", markersize=10)
fig=plt.figure()
ax=fig.add_subplot(111, facecolor="honeydew")
x=np.linspace(0, 2*np.pi, 500)
y=np.sin(x)*np.cos(x)
ax.plot(x, y, dashes=[10, 2], label="dashes=[10, 2]", **line_marker_style1)
ax.plot(x, y+0.2, dashes=[3, 1], label="dashes=[3, 1]", **line_marker_style2)
ax.plot(x, y+0.4, dashes=[2, 2, 8, 2], label="dashes=[2, 2, 8, 2]", **line_marker_style3)
ax.axis([0, 2*np.pi, -0.7, 1.2])
ax.legend(ncol=3, bbox_to_anchor=(0.00, 0.95, 1.0, 0.05), mode="expand",
fancybox=True, shadow=True, prop=font_style)
plt.show()
View Code
=============================================
图 9.7

import numpy as np
font_style=dict(family="sans-serif", color="saddlebrown", weight="semibold", size=16)
line_marker_style=dict(linestyle=":", linewidth=2, color="cornflowerblue",
markerfacecoloralt="lightgrey", marker="o", markersize=10)
fig=plt.figure()
ax=fig.add_subplot(111)
fillstyleList=["full", "left", "right", "bottom", "top", "none"]
x=np.arange(3, 11, 1)
y=np.linspace(1, 1, 8)
ax.text(4, 6.5, "fill styles", **font_style)
for i, fs in enumerate(fillstyleList):
ax.text(0, i+0.4, "'{}'".format(fs), **font_style)
ax.plot(x, (i+0.5)*y, fillstyle=fs, **line_marker_style)
ax.set_xlim(-1, 11)
ax.set_ylim(0, 7)
ax.margins(0, 3)
ax.set_xticks([])
ax.set_yticks([])
plt.show()
View Code
=============================================