seaborn在matplotlib的基础上进行开发,当然也继承了matplotlib的颜色梯度设置, 同时也自定义了一系列独特的颜色梯度。在seaborn中,通过color_palette函数来设置颜色, 用法如下
>>> sns.color_palette()[(0.12156862745098039, 0.4666666666666667, 0.7058823529411765), (1.0, 0.4980392156862745, 0.054901960784313725), (0.17254901960784313, 0.6274509803921569, 0.17254901960784313), (0.8392156862745098, 0.15294117647058825, 0.1568627450980392), (0.5803921568627451, 0.403921568627451, 0.7411764705882353), (0.5490196078431373, 0.33725490196078434, 0.29411764705882354), (0.8901960784313725, 0.4666666666666667, 0.7607843137254902), (0.4980392156862745, 0.4980392156862745, 0.4980392156862745), (0.7372549019607844, 0.7411764705882353, 0.13333333333333333), (0.09019607843137255, 0.7450980392156863, 0.8117647058823529)]
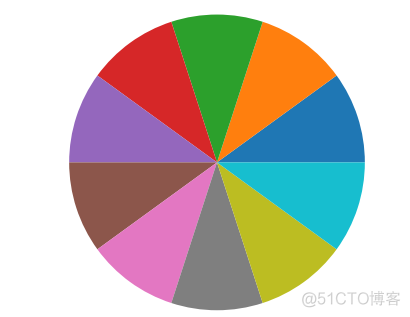
返回的是RGB颜色数组,不加任何参数的情况下,返回值就是matplotlib默认的颜色梯度,以下两个代码的输出结果相同
>>> plt.pie(x)>>> plt.pie(x, colors=sns.color_palette())
输出结果如下
该函数接受多种形式的参数
1. seaborn palette name
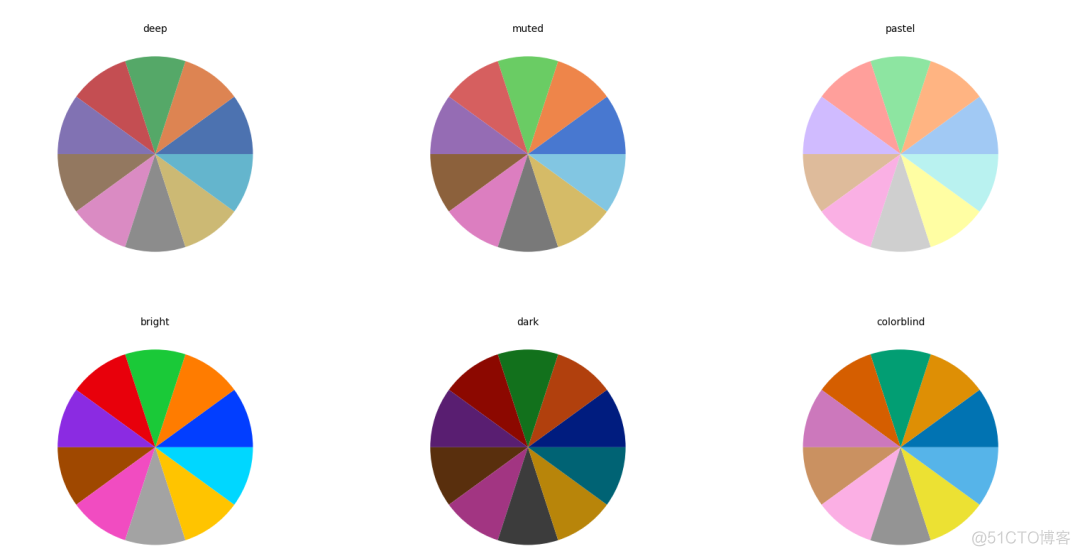
在seaborn中,提供了以下6种颜色梯度
1. deep
2. muted
3. bright
4. pastel
5. drak
6. colorbind
不同颜色梯度的效果如下
>>> palettes = ['deep', 'muted', 'pastel', 'bright', 'dark', 'colorblind']>>> row, col = 0, 0
>>> for index, palette in enumerate(palettes):
... if index % 3 == 0 and index != 0:
... row += 1
... col = 0
... print(row, col)
... ax = axes[row, col]
... ax.pie(x, colors = sns.color_palette(palette))
... ax.text(0.5, 1, palette, transform=ax.transAxes, ha='center')
... col += 1
...
>>> plt.show()
输出结果如下
2. matplotlib palette name
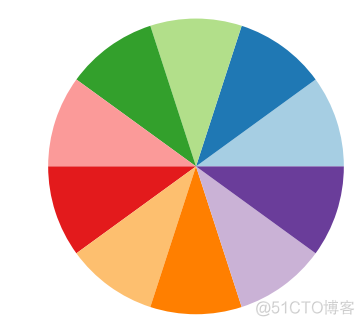
matplotlib中丰富的patlette名称都可以拿过来使用,用法如下
>>> plt.pie(x, colors=sns.color_palette('Paired'))>>> plt.show()
3. husl and hsl palette
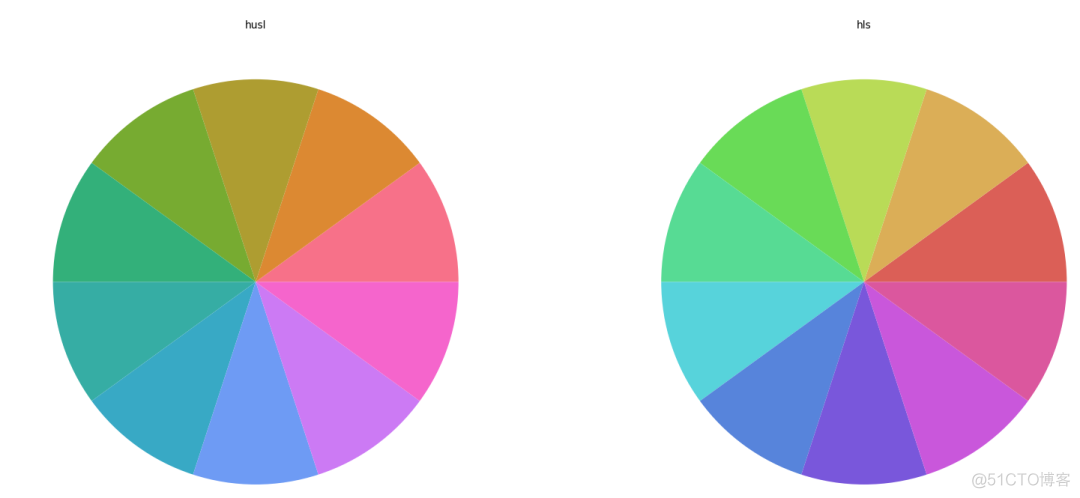
seaborn支持通过色相,饱和度,明度来设置颜色,具体的是通过husl_palette和hsl_palette两个子函数来实现,用法如下
>>> fig, (ax1, ax2) = plt.subplots(1, 2)>>> ax1.pie(x, colors=sns.color_palette('husl', 10))
>>> ax1.text(0.5, 1, 'husl', transform=ax1.transAxes, ha='center')
>>> ax2.pie(x, colors=sns.color_palette('hls', 10))
>>> ax2.text(0.5, 1, 'hls', transform=ax2.transAxes, ha='center')
>>> plt.show()
输出结果如下
4. cubehelix palette
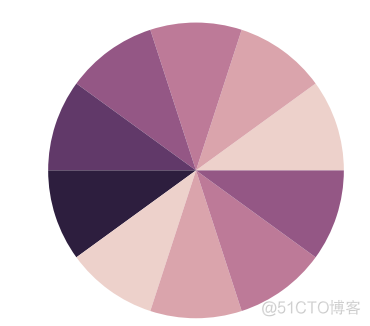
通过子函数cubehelix_palette来实现,创建一个亮度线性变化的颜色梯度,在color_palette中,通过前缀ch:来标识对应的参数,用法如下
>>> plt.pie(x, colors=sns.color_palette('ch:'))>>> plt.show()
输出结果如下
5. light, dark and blend palette
也都是通过调用子函数来实现的,基本用法如下
>>> fig, (ax1, ax2, ax3) = plt.subplots(1, 3)>>> ax1.pie(x, colors=sns.color_palette('light:blue'))
>>> ax1.text(0.5, 1, 'light_palette', transform=ax1.transAxes, ha='center')
>>> ax2.pie(x, colors=sns.color_palette('dark:blue'))
>>> ax2.text(0.5, 1, 'dark_palette', transform=ax2.transAxes, ha='center')
>>> ax3.pie(x, colors=sns.color_palette('blend:red,blue'))
>>> ax3.text(0.5, 1, 'blend_palette', transform=ax3.transAxes, ha='center')
>>> plt.show()
输出结果如下

6. sequence of colors
自定义颜色,通过输入一个matplotlib可以识别的颜色代码来构建颜色梯度,用法如下
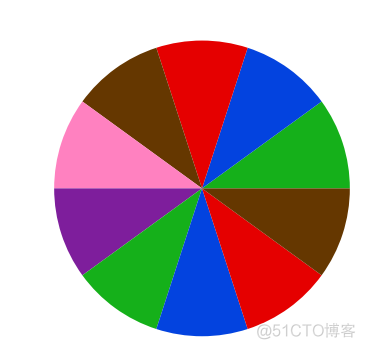
>>> plt.pie(x, colors=sns.color_palette(['xkcd:green','xkcd:blue','xkcd:red', 'xkcd:brown', 'xkcd:pink', 'xkcd:purple']))>>> plt.show()
使用了一系列的xkcd颜色梯度,输出结果如下
在seaborn中,还提供了4种独特的渐变色,用于绘制热图
1. rocket
2. flare
3. mako
4. crest
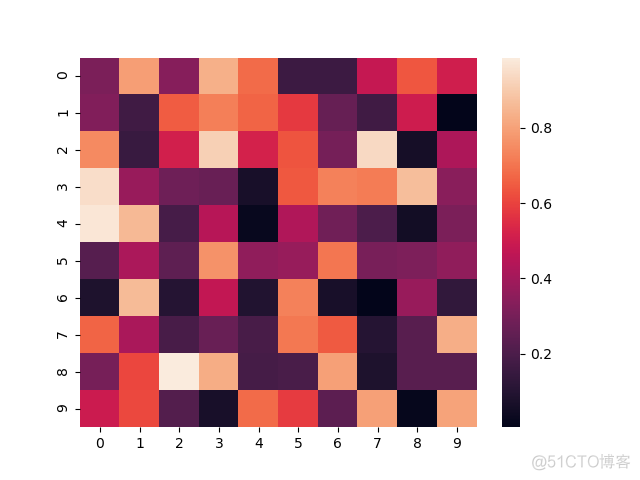
rocker是默认的颜色梯度
>>> sns.heatmap(data, cmap='rocket')>>> plt.show()
输出结果如下
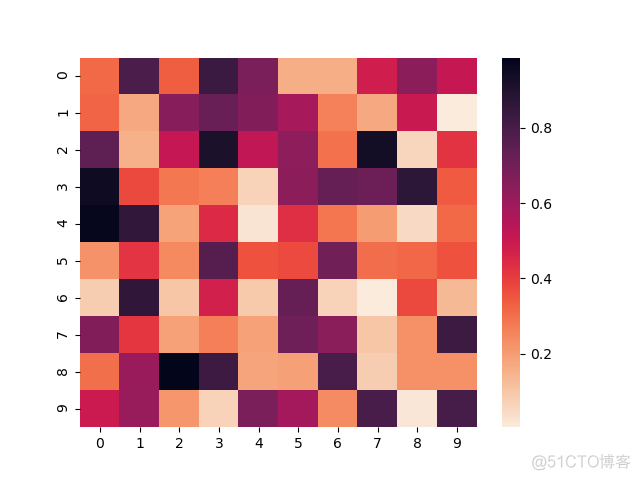
和matplotlib类似,添加后缀_r可以将颜色梯度反转
>>> sns.heatmap(data, cmap='rocket_r')>>> plt.show()
输出结果如下
对于seaborn而言,其支持的色相,饱和度,亮度调色系统,大大扩展了颜色的范围,同时其内置的一些颜色梯度,也提供了优雅的可视化效果,兼顾了 灵活性和便利性。
·end·

一个只分享干货的
生信公众号
