from calendar import day_name from matplotlib . ticker import FormatStrFormatter import matplotlib as mpl import matplotlib . pyplot as plt import numpy as np 向画布中任意位置添加任意数量的坐标轴 def no1 (): """ 向画布中
from matplotlib.ticker import FormatStrFormatter
import matplotlib as mpl
import matplotlib.pyplot as plt
import numpy as np
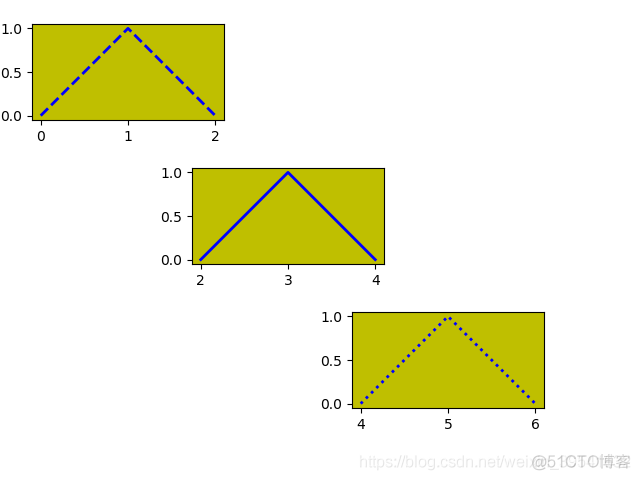
"""
向画布中任意位置添加任意数量的坐标轴
:return:
"""
# axes(rect, frameon=True,axisbg='y')
# rect = [left, bottom, width, height] 坐标轴的左侧边缘和底部边缘距离画布边缘的距离
# width, height: 坐标轴的宽度和高度
# frameon: 是否绘制坐标轴的四条轴脊
# axisbg: 填充坐标轴的背景的颜色
plt.axes([0.05, 0.7, .3, .3], frameon=True, fc='y', aspect='equal')
plt.plot(np.arange(3), [0, 1, 0], color='blue',
linewidth=2, linestyle='--')
plt.axes([0.3, 0.4, .3, .3], frameon=True, fc='y', aspect='equal')
plt.plot(2 + np.arange(3), [0, 1, 0], color='blue', linewidth=2,
linestyle='-')
plt.axes([0.55, 0.1, .3, .3], frameon=True, fc='y', aspect='equal')
plt.plot(4 + np.arange(3), [0, 1, 0], color='blue', linewidth=2,
linestyle=':')
plt.savefig(r"E:\Programmer\PYTHON\Matplotlib实践\figure\Figure(Unit "
r"8)\no1.png")
plt.show()
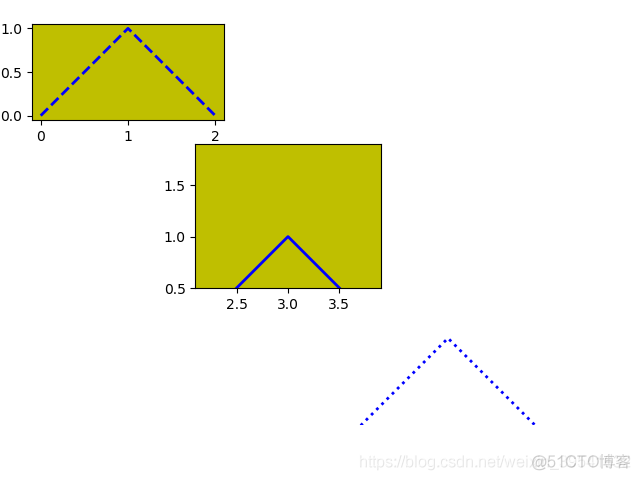
"""
调整已经确定的坐标轴的显示、隐藏与刻度范围等问题
:return:
"""
plt.axes([0.05, 0.7, .3, .3], frameon=True, fc='y', aspect='equal')
plt.plot(np.arange(3), [0, 1, 0], color='blue',
linewidth=2, linestyle='--')
plt.ylim(0, 1.5)
# 将图形变得紧凑
plt.axis("image")
plt.axes([0.3, 0.4, .3, .3], frameon=True, fc='y', aspect='equal')
plt.plot(2 + np.arange(3), [0, 1, 0], color='blue', linewidth=2,
linestyle='-')
plt.ylim(0, 15)
# axis([xmin, xmax, ymin, ymax])
plt.axis([2.1, 3.9, 0.5, 1.9])
plt.axes([0.55, 0.1, .3, .3], frameon=True, fc='y', aspect='equal')
plt.plot(4 + np.arange(3), [0, 1, 0], color='blue', linewidth=2,
linestyle=':')
plt.ylim(0, 1.5)
# 是否显示坐标轴
plt.axis("off")
plt.savefig(r"E:\Programmer\PYTHON\Matplotlib实践\figure\Figure(Unit "
r"8)\no2.png")
plt.show()
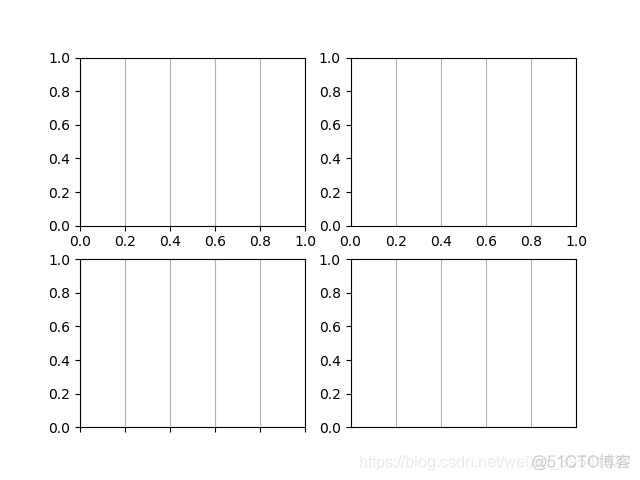
"""
调用函数setp()设置刻度标签
:return:
"""
ax1 = plt.subplot(221)
plt.setp(ax1.get_xticklabels(), visible=True)
plt.setp(ax1.get_xticklines(), visible=True)
plt.grid(True, axis='x')
ax2 = plt.subplot(222)
plt.setp(ax2.get_xticklabels(), visible=True)
plt.setp(ax2.get_xticklines(), visible=False)
plt.grid(True, axis='x')
ax3 = plt.subplot(223)
plt.setp(ax3.get_xticklabels(), visible=False)
plt.setp(ax3.get_xticklines(), visible=True)
plt.grid(True, axis='x')
ax4 = plt.subplot(224)
plt.setp(ax4.get_xticklabels(), visible=False)
plt.setp(ax4.get_xticklines(), visible=False)
plt.grid(True, axis='x')
plt.savefig(r"E:\Programmer\PYTHON\Matplotlib实践\figure\Figure(Unit "
r"8)\no3.png")
plt.show()
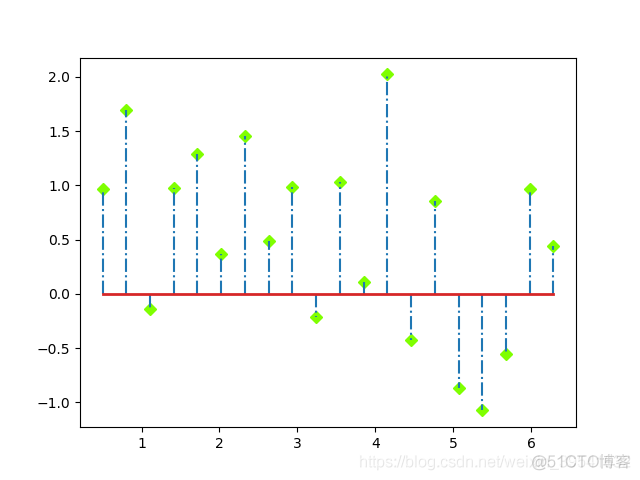
"""
棉棒图的定制化展示
:return:
"""
x = np.linspace(0.5, 2 * np.pi, 20)
y = np.random.randn(20)
markerline, stemlines, baseline = plt.stem(x, y)
plt.setp(markerline, color='chartreuse', marker='D')
plt.setp(stemlines, linestyle='-.')
baseline.set_linewidth(2)
plt.savefig(r"E:\Programmer\PYTHON\Matplotlib实践\figure\Figure(Unit "
r"8)\no4.png")
plt.show()
"""
坐标轴的样式和位置的定制化展示
:return:
"""
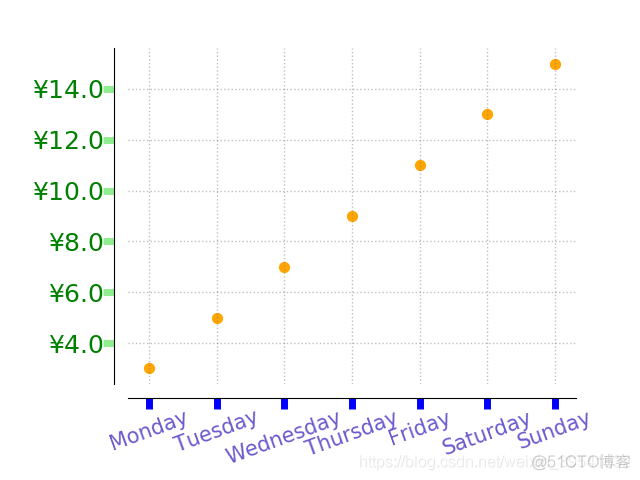
fig = plt.figure()
ax = fig.add_axes([0.2, 0.2, 0.7, 0.7])
ax.spines['bottom'].set_position(('outward', 10))
ax.spines['left'].set_position(('outward', 10))
ax.spines['top'].set_color("none")
ax.spines['right'].set_color("none")
x = np.arange(1, 8, 1)
y = 2 * x + 1
ax.scatter(x, y, c='orange', s=50, edgecolors='orange')
for tickline in ax.xaxis.get_ticklines():
tickline.set_color("blue")
tickline.set_markersize(8)
tickline.set_markeredgewidth(5)
for ticklabel in ax.get_xmajorticklabels():
ticklabel.set_color("slateblue")
ticklabel.set_fontsize(15)
ticklabel.set_rotation(20)
ax.yaxis.set_major_formatter(FormatStrFormatter(r"$\yen%1.1f$"))
plt.xticks(x, day_name[0:7], rotation=20)
ax.yaxis.set_ticks_position("left")
ax.xaxis.set_ticks_position("bottom")
for tickline in ax.yaxis.get_ticklines():
tickline.set_color("lightgreen")
tickline.set_markersize(8)
tickline.set_markeredgewidth(5)
for ticklabel in ax.get_ymajorticklabels():
ticklabel.set_color('green')
ticklabel.set_fontsize(18)
ax.grid(ls=':', lw=1, color='gray', alpha=0.5)
plt.savefig(r"E:\Programmer\PYTHON\Matplotlib实践\figure\Figure(Unit "
r"8)\no5.png")
plt.show()
"""
移动坐标轴的位置
:return:
"""
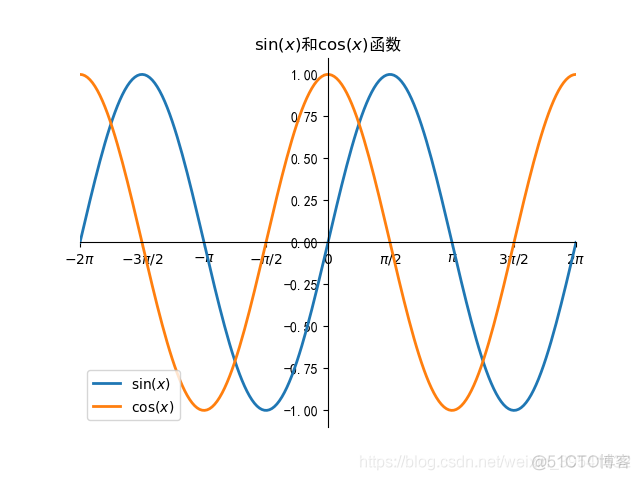
mpl.rcParams["font.sans-serif"] = ["SimHei"]
mpl.rcParams["axes.unicode_minus"] = False
x = np.linspace(-2 * np.pi, 2 * np.pi, 200)
y = np.sin(x)
y1 = np.cos(x)
ax = plt.subplot(111)
ax.plot(x, y, ls='-', lw=2, label=r'$\sin(x)$')
ax.plot(x, y1, ls='-', lw=2, label=r'$\cos(x)$')
ax.legend(loc='lower left')
plt.title(r"$\sin(x)$" + "和" + r"$\cos(x)$" + "函数")
ax.set_xlim(-2 * np.pi, 2 * np.pi)
plt.xticks([-2 * np.pi, -3 * np.pi / 2, -1 * np.pi, -1 * (np.pi) / 2, 0, (np.pi) / 2,
np.pi, 3 * np.pi / 2, 2 * np.pi], [r"$-2\pi$", r"$-3\pi/2$", r"$-\pi$",
r"$-\pi/2$", "$0$", r"$\pi/2$",
"$\pi$", "$3\pi/2$", "$2\pi$"])
ax.spines['top'].set_color("none")
ax.spines['right'].set_color("none")
ax.spines['bottom'].set_position(('data', 0))
ax.spines['left'].set_position(('data', 0))
ax.xaxis.set_ticks_position("bottom")
ax.yaxis.set_ticks_position("left")
plt.savefig(r"E:\Programmer\PYTHON\Matplotlib实践\figure\Figure(Unit "
r"8)\no6.png")
plt.show()
- 本篇博文特别感谢刘大成的《Python数据可视化之matplotlib实践》
