缩写 颜色名 缩写 颜色名 缩写 颜色名 缩写 颜色名 b 蓝色 g 绿色 r 红色 c 青色 m 洋红色 y 黄色 k 黑色 w 白色 import matplotlib as mpl import matplotlib . pyplot as plt import numpy as np 通过属性字典r
缩写
颜色名
缩写
颜色名
缩写
颜色名
缩写
颜色名
b
蓝色
g
绿色
r
红色
c
青色
m
洋红色
y
黄色
k
黑色
w
白色
import matplotlib.pyplot as plt
import numpy as np
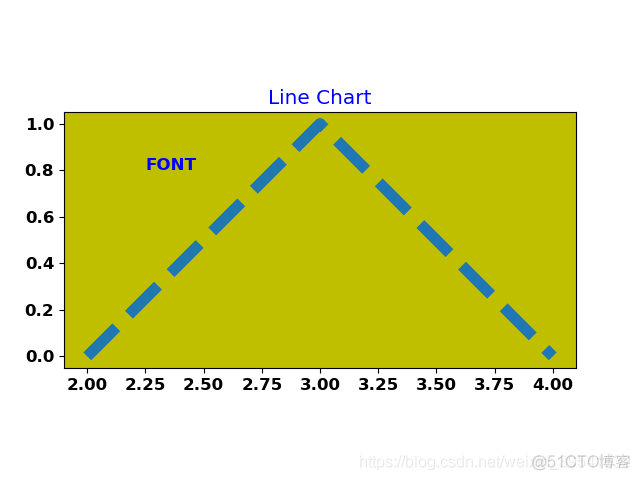
"""
通过属性字典rcParams调整字体属性值和文本属性值
:return:
"""
# line properties in change
plt.rcParams["lines.linewidth"] = 8.0
plt.rcParams["lines.linestyle"] = "--"
# font properties in change
plt.rcParams["font.family"] = "serif"
plt.rcParams["font.serif"] = "New Century Schoolbook"
plt.rcParams["font.style"] = "normal"
plt.rcParams["font.variant"] = "small-caps"
plt.rcParams["font.weight"] = "black"
plt.rcParams["font.size"] = 12.0
# text properties in change
plt.rcParams["text.color"] = "blue"
plt.axes([0.1, 0.1, .8, .8], frameon=True, fc='y', aspect='equal')
plt.plot(2 + np.arange(3), [0, 1, 0])
plt.title("Line Chart")
plt.text(2.25, .8, "FONT")
plt.savefig(r"E:\Programmer\PYTHON\Matplotlib实践\figure\Figure(Unit "
r"10)\no1.png")
plt.show()
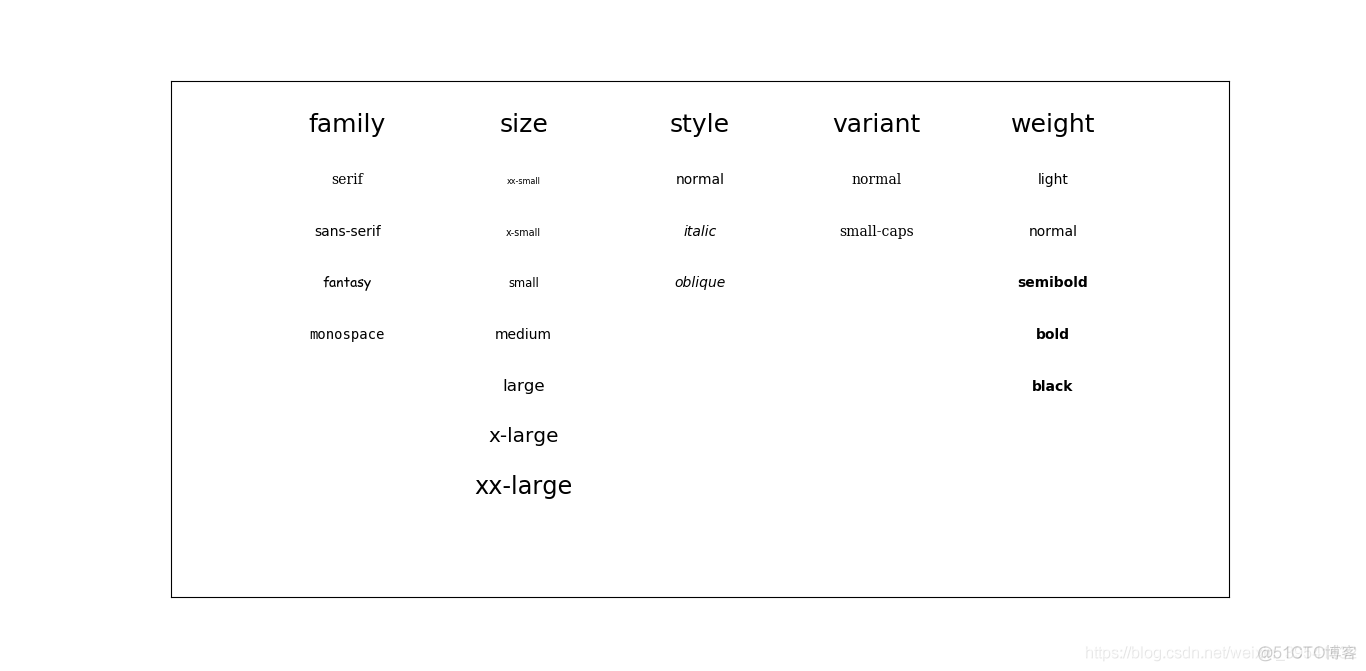
"""
字体主要属性的可视化展示
:return:
"""
fig = plt.figure()
ax = fig.add_subplot(111)
families = ["serif", "sans-serif", "fantasy", "monospace"]
ax.text(-1, 1, "family", fontsize=18, horizontalalignment='center')
pi = (0.9, 0.8, 0.7, 0.6, 0.5, 0.4, 0.3, 0.2, 0.1)
for i, family in enumerate(families):
ax.text(-1, pi[i], family, family=family, horizontalalignment='center')
sizes = ["xx-small", "x-small", "small", "medium", "large", "x-large",
"xx-large"]
ax.text(-0.5, 1, "size", fontsize=18, horizontalalignment="center")
for i, size in enumerate(sizes):
ax.text(-0.5, pi[i], size, size=size, horizontalalignment="center")
styles = ["normal", "italic", "oblique"]
ax.text(0, 1, "style", fontsize=18, horizontalalignment="center")
for i, style in enumerate(styles):
ax.text(0, pi[i], style, family="sans-serif", style=style,
horizontalalignment='center')
variants = ["normal", "small-caps"]
ax.text(0.5, 1, "variant", fontsize=18, horizontalalignment='center')
for i, variant in enumerate(variants):
ax.text(0.5, pi[i], variant, family="serif", variant=variant,
horizontalalignment='center')
weights = ["light", "normal", "semibold", "bold", "black"]
ax.text(1, 1, "weight", fontsize=18, horizontalalignment='center')
for i, weight in enumerate(weights):
ax.text(1, pi[i], weight, weight=weight,
horizontalalignment='center')
ax.axis([-1.5, 1.5, 0.1, 1.1])
ax.set_xticks([])
ax.set_yticks([])
plt.savefig(r"E:\Programmer\PYTHON\Matplotlib实践\figure\Figure(Unit "
r"10)\no2.png")
plt.show()
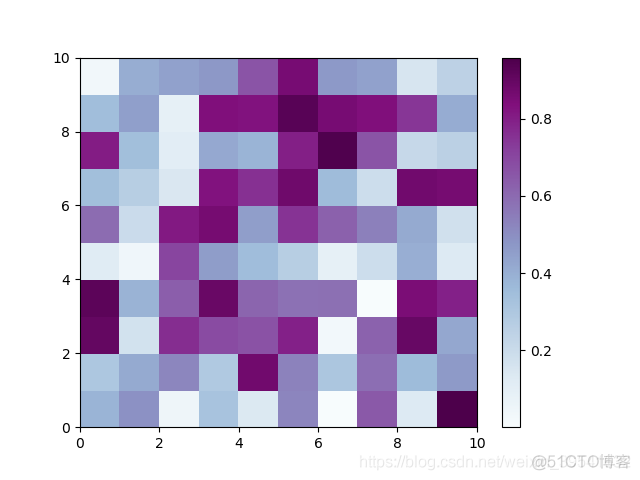
"""
模拟图的颜色使用模式
:return:
"""
rd = np.random.rand(10, 10)
plt.pcolor(rd, cmap="BuPu")
plt.colorbar()
plt.savefig(r"E:\Programmer\PYTHON\Matplotlib实践\figure\Figure(Unit "
r"10)\no3.png")
plt.show()
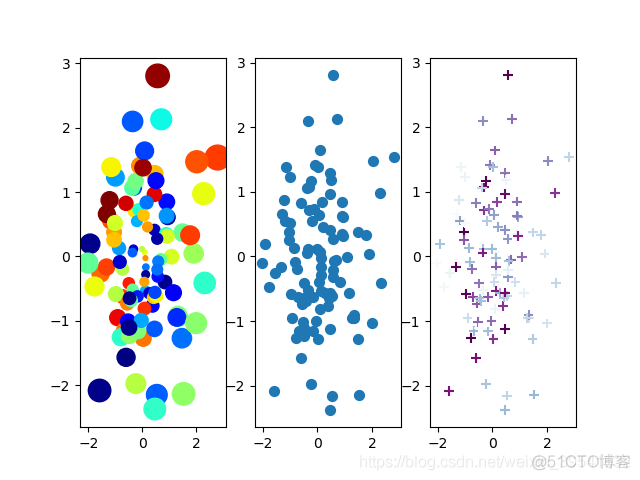
"""
散点图的颜色使用模式
:return:
"""
a = np.random.randn(100)
b = np.random.randn(100)
exponent = 2
plt.subplot(131)
plt.scatter(
a,
b,
np.sqrt(
np.power(
a,
exponent) +
np.power(
b,
exponent)) *
100,
c=np.random.rand(100),
cmap=mpl.cm.jet,
marker='o',
zorder=1)
plt.subplot(132)
plt.scatter(a, b, 50, marker='o', zorder=10)
plt.subplot(133)
plt.scatter(a, b, 50, c=np.random.rand(100),
cmap=mpl.cm.BuPu,
marker='+',
zorder=100)
plt.savefig(r"E:\Programmer\PYTHON\Matplotlib实践\figure\Figure(Unit "
r"10)\no4.png")
plt.show()
"""
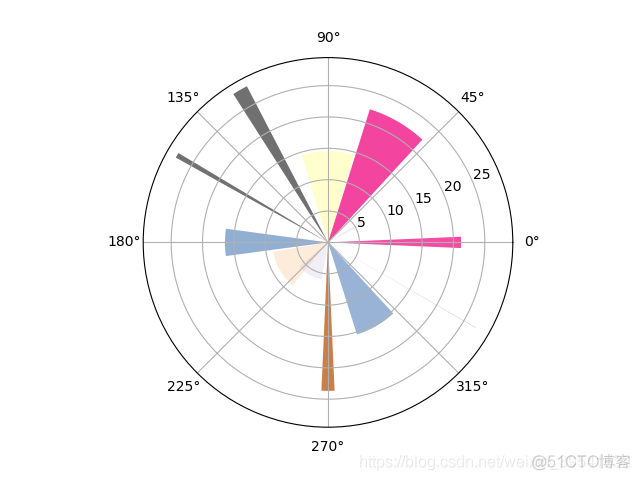
极区图的颜色使用模式
:return:
"""
barSlices = 12
theta = np.linspace(0.0, 2 * np.pi, barSlices, endpoint=False)
radii = 30 * np.random.rand(barSlices)
width = np.pi / 4 * np.random.rand(barSlices)
fig = plt.figure()
ax = fig.add_subplot(111, polar=True)
bars = ax.bar(theta, radii, width=width, bottom=0.0)
for r, bar in zip(radii, bars):
bar.set_facecolor(mpl.cm.Accent(r / 30.))
bar.set_alpha(r / 30.)
plt.savefig(r"E:\Programmer\PYTHON\Matplotlib实践\figure\Figure(Unit "
r"10)\no5.png")
plt.show()
"""
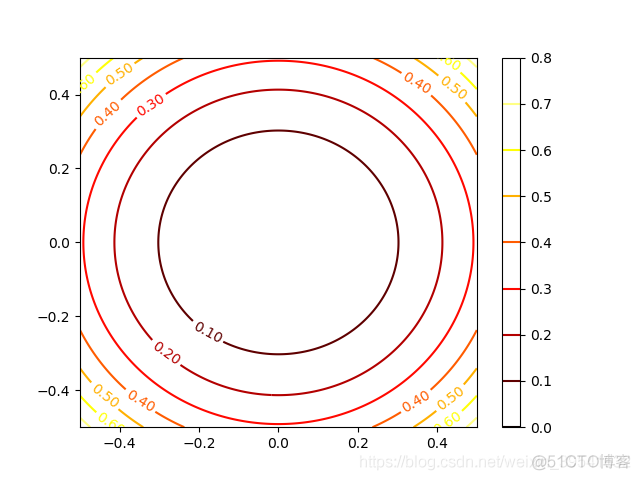
等高线的颜色使用模式
:return:
"""
s = np.linspace(-0.5, 0.5, 1000)
x, y = np.meshgrid(s, s)
fig, ax = plt.subplots(1, 1)
z = x**2 + y**2 + np.power(x**2 + y**2, 2)
cs = plt.contour(x, y, z, cmap=mpl.cm.hot)
plt.clabel(cs, fmt="%3.2f")
plt.colorbar(cs)
plt.savefig(r"E:\Programmer\PYTHON\Matplotlib实践\figure\Figure(Unit "
r"10)\no6.png")
plt.show()
- 本篇博文特别感谢刘大成的《Python数据可视化之matplotlib实践》
