下图是来自文献中的一个示例图,展示了不同亚型之间risk score值的差异分析结果 从图形的主题可以看出,这是一幅基于ggplot2绘制的图片,但是如果完全基于ggplot2的基础函数的话,我们
下图是来自文献中的一个示例图,展示了不同亚型之间risk score值的差异分析结果
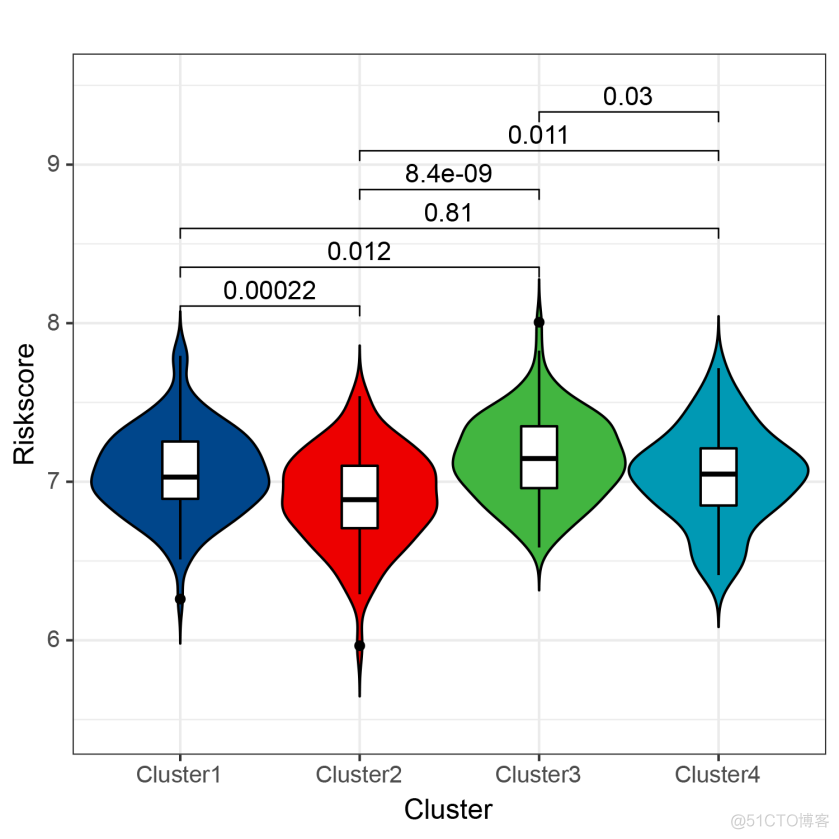
从图形的主题可以看出,这是一幅基于ggplot2绘制的图片,但是如果完全基于ggplot2的基础函数的话,我们需要手动绘制组间比较的连线,计算对应的坐标并添加p值,虽然也可以实现,但不免太过繁琐。
想要更加便利的展示组间差异的结果,可以使用ggpubr这个R包。这是一个基于ggplot2的拓展包,体用了丰富的可视化功能,差异标记的可视化仅仅是其功能之一。
首先来看下其基本用法,代码如下
> library(ggpubr)载入需要的程辑包:ggplot2
Want to understand how all the pieces fit together? Read R for Data
Science: https://r4ds.had.co.nz/
> data("ToothGrowth")
> df <- ToothGrowth
> head(df, 4)
len supp dose
1 4.2 VC 0.5
2 11.5 VC 0.5
3 7.3 VC 0.5
4 5.8 VC 0.5
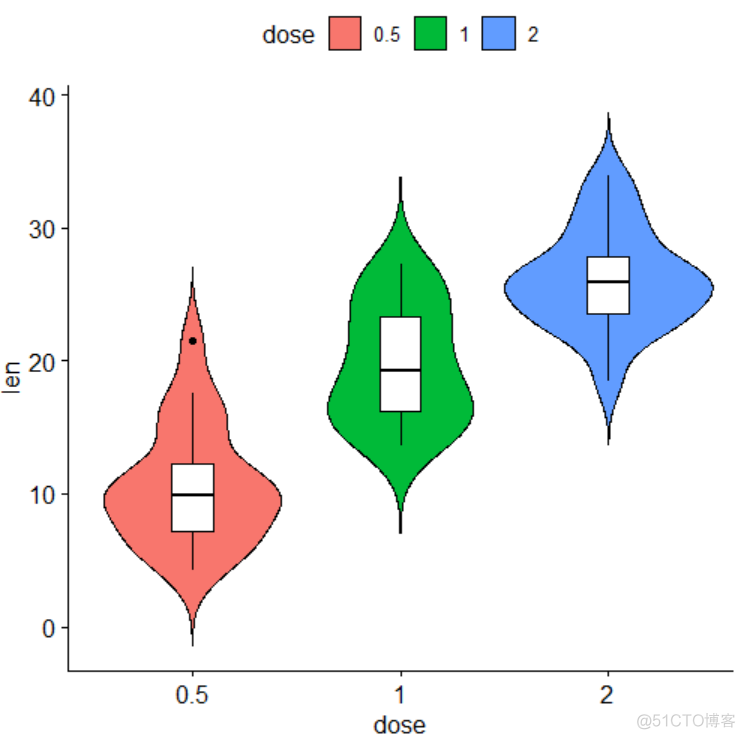
> ggviolin(df, x = "dose", y = "len", fill = "dose",add = "boxplot", add.params = list(fill = "white"))
ggviolin函数提供了小提琴图的可视化功能,通过add=boxplot在小提琴图的基础上添加了箱体图,效果图如下
接下来添加差异分析的p值, 代码如下
> ggviolin(+ df, x = "dose", y = "len",+ fill = "dose",
+ add = "boxplot",
+ add.params = list(fill = "white")) +
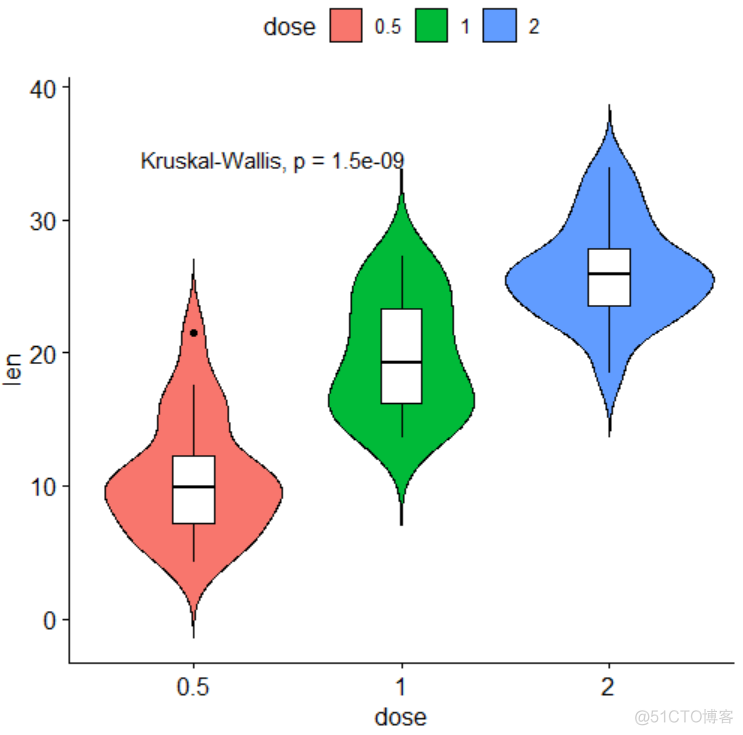
+ stat_compare_means()
stat_compare_means函数添加差异分析的p值,默认参数的情况下,添加组间kw检验的结果,效果图如下
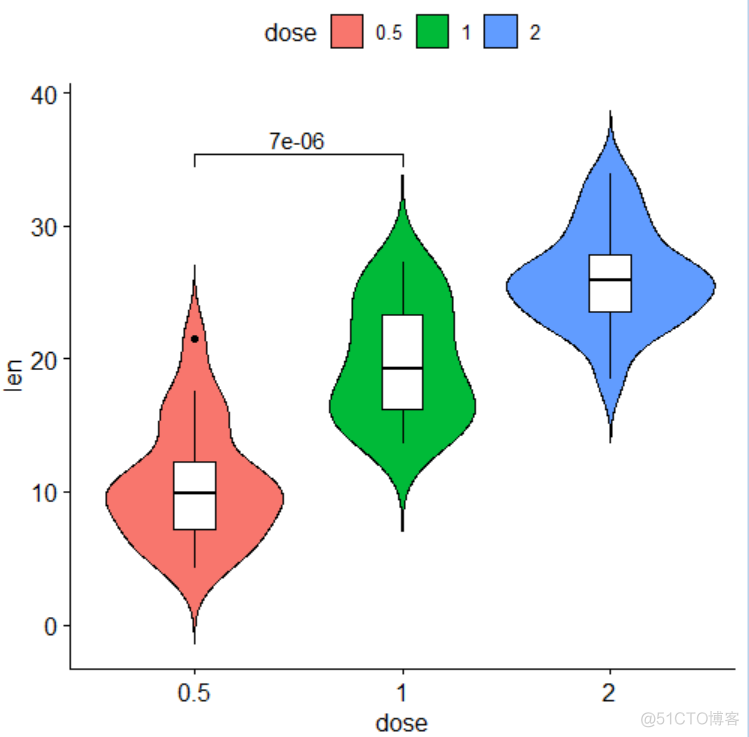
也可以手动指定需要标记的分组,代码如下
+ df, x = "dose", y = "len",
+ fill = "dose",
+ add = "boxplot",
+ add.params = list(fill = "white")) +
+ stat_compare_means(comparisons = list(c("0.5", "1")))
程序会自动计算坐标,标记p值,效果图如下
需要注意的是,当涉及到多组间的两两比较时,写法上比较特殊,对于3组间的两两比较,我们先看下每次指定一组差异分析的情况,代码如下
> ggviolin(+ df, x = "dose", y = "len",
+ fill = "dose",
+ add = "boxplot",
+ add.params = list(fill = "white")) +
+ stat_compare_means(comparisons = list(c("0.5", "1"))) +
+ stat_compare_means(comparisons = list(c("1", "2"))) +
+ stat_compare_means(comparisons = list(c("0.5", "2")))
效果图如下
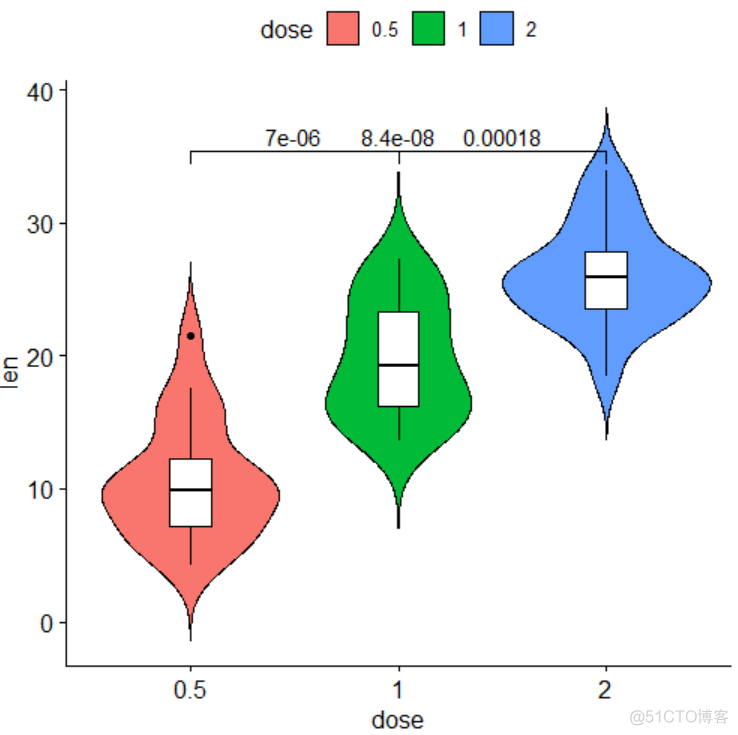
可以看到,程序没有自动化的计算3组p值的位置,导致重叠了,为了避免这种情况,我们需要下列这种写法
> ggviolin(+ df, x = "dose", y = "len",
+ fill = "dose",
+ add = "boxplot",
+ add.params = list(fill = "white")) +
+ stat_compare_means(comparisons = list( c("0.5", "1"), c("1", "2"), c("0.5", "2") ))
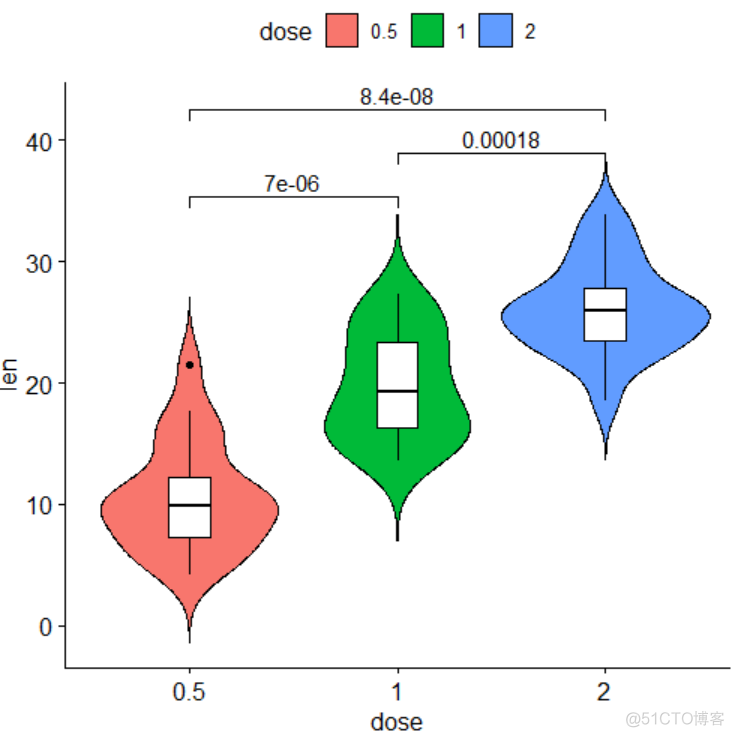
需要把3组差异分组包含在一个list中,这样程序就会自动计算标记p值的位置,将3组p值自动化的区分开,效果图如下
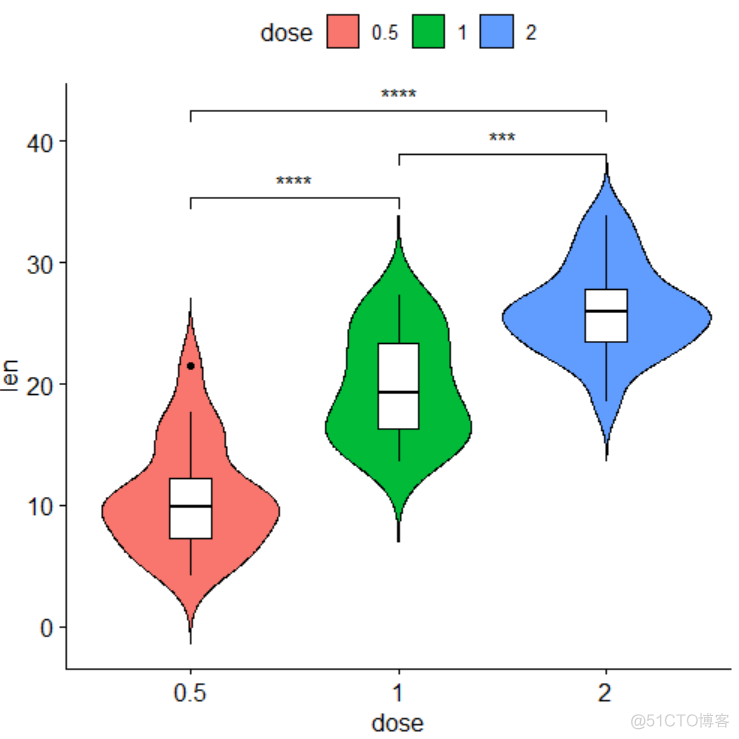
除了直接标记p值外,也支持用星号代替,将代码如下
> ggviolin(+ df, x = "dose", y = "len",
+ fill = "dose",
+ add = "boxplot",
+ add.params = list(fill = "white")) +
+ stat_compare_means(
+ label = "p.signif",
+ comparisons = list( c("0.5", "1"), c("1", "2"), c("0.5", "2"))
+ )
效果图如下
最后,来看一个官网的示例,看下以上所有参数组合使用的例子,代码如下
> comparisons <- list( c("0.5", "1"), c("1", "2"), c("0.5", "2") )> ggviolin(
+ df, x = "dose", y = "len", fill = "dose",
+ palette = c("#00AFBB", "#E7B800", "#FC4E07"),
+ add = "boxplot", add.params = list(fill = "white")) +
+ stat_compare_means(comparisons = my_comparisons, label = "p.signif") +
+ stat_compare_means(label.y = 50)
效果图如下
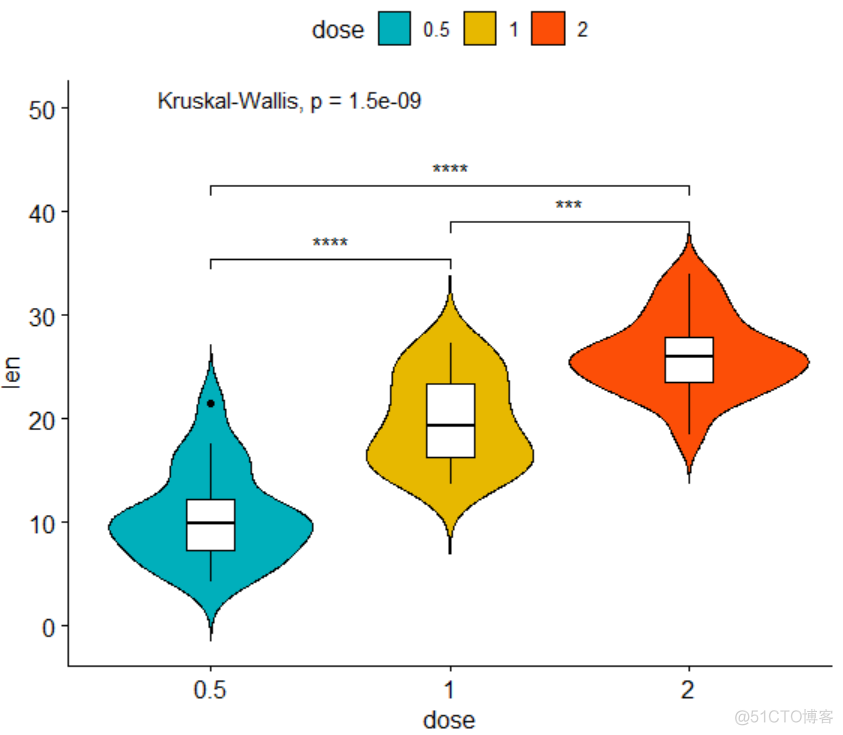
掌握了以上用法,绘制文章开头的那张图片就不在是难事了。
·end·

一个只分享干货的
生信公众号
